When working with real-time monitoring systems, engineers need a simple way to visualize continuously changing data. Whether it’s temperature, pressure, voltage, or sensor readings, seeing live data helps identify trends and detect issues quickly.
This is where Strip Chart LabVIEW becomes useful. Engineers use Strip Chart LabVIEW to monitor live data streams and identify process changes in real time.
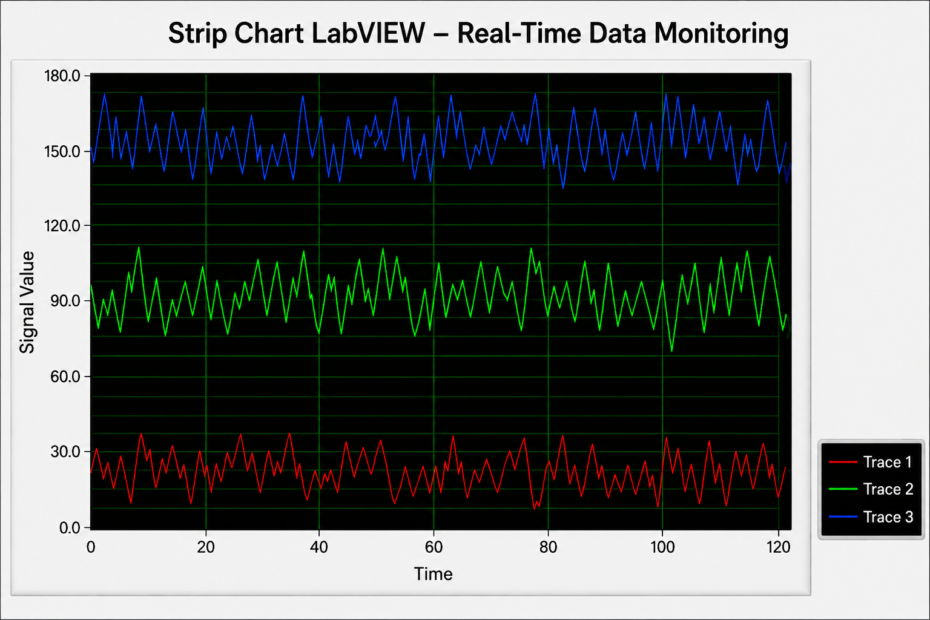
A Strip Chart displays incoming data continuously. New values appear on the right side of the chart while older values move toward the left, creating a live scrolling display. This makes it ideal for monitoring processes in real time.
What Is Strip Chart LabVIEW?
Strip Chart is an update mode available in the LabVIEW Waveform Chart.
Unlike static graphs, it continuously updates as new data arrives. This allows users to monitor live process values without stopping the application.
Strip Chart LabVIEW is commonly used for:
- Industrial automation
- Data acquisition systems
- Test and measurement applications
- Machine monitoring
- Research and laboratory projects
How Does Strip Chart LabVIEW Work?
The process is straightforward:
- A sensor, DAQ device, or instrument generates data.
- LabVIEW collects the data using a While Loop.
- The data is sent to a Waveform Chart.
- The chart updates automatically as new values arrive.
As new readings are plotted, older readings move left, creating a continuous scrolling effect.
How to Configure Strip Chart LabVIEW
Step 1: Add a Waveform Chart
Go to:
Controls → Graph → Waveform Chart
Place the chart on the Front Panel.
Step 2: Enable Strip Chart Mode
Right-click the chart and select:
Advanced → Update Mode → Strip Chart
Step 3: Set Chart History Length
Right-click the chart and select Chart History Length.
This controls how much past data remains visible on the screen. Increase this value if you want to see a longer history of your data.
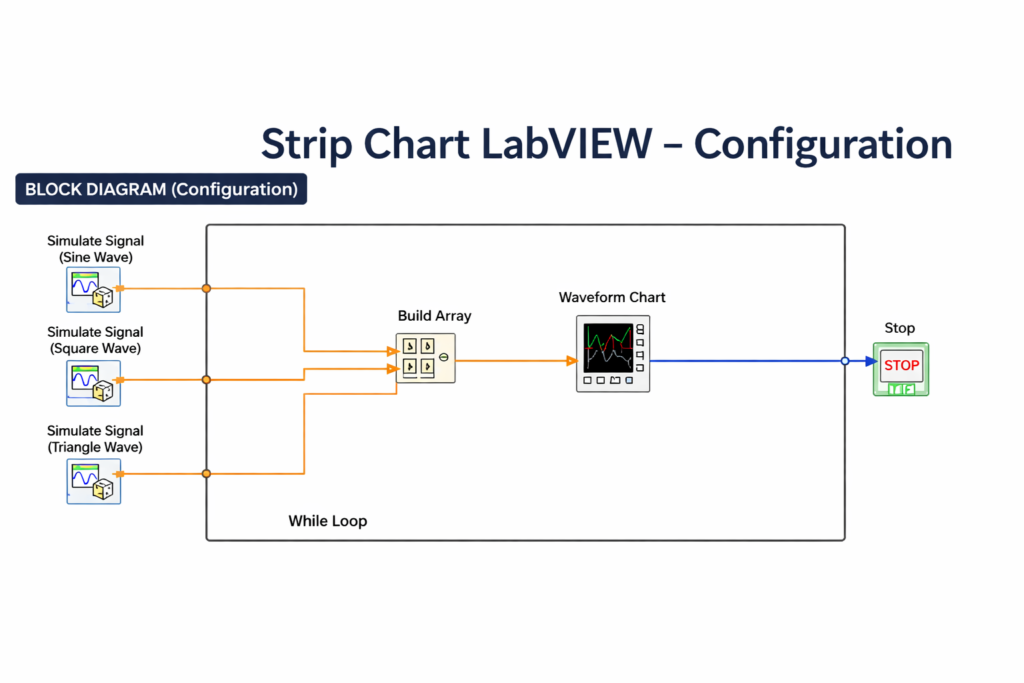
Step 4: Create a While Loop
In the Block Diagram, add a While Loop to continuously acquire data.
Step 5: Connect Your Data Source
Connect a signal source such as:
- Simulate Signal
- DAQ Assistant
- Sensor Input
- PLC Data
Step 6: Add Timing Control
Insert a Wait (ms) function inside the loop to prevent excessive CPU usage and control the update speed of your chart.
Step 7: Run the Application
Click Run and your Strip Chart will start displaying live data instantly.
Benefits of Strip Chart LabVIEW
Real-Time Monitoring: View live process data without any delays.
Easy Trend Analysis: Identify fluctuations and process changes quickly.
Faster Troubleshooting: Detect abnormal conditions before they affect operations.
Multiple Signal Display: Monitor several signals on a single chart at the same time.
User-Friendly Configuration: Easy to set up, even for beginners with basic LabVIEW knowledge.
Applications of Strip Chart LabVIEW
Strip Chart LabVIEW is widely used in:
- Temperature monitoring systems
- Voltage and current measurement
- Industrial automation projects
- Pharmaceutical manufacturing
- Research laboratories
- Test and measurement systems
Its real-time visualization capabilities make it a valuable tool for engineers and technicians.
Common Problems and Solutions
Chart Updates Too Fast: Increase the Wait (ms) value inside the While Loop to slow down the update rate.
High CPU Usage: Reduce update rates and add proper timing control using the Wait (ms) function.
Chart Appears Frozen: Verify that data is reaching the chart and the While Loop is running correctly. Check all wire connections in the Block Diagram.
Multiple Signals Not Visible: Use bundled data or arrays when plotting multiple signals on the same chart.
Cannot See Enough History: Right-click the chart and increase the Chart History Length to display more past data on screen.
Conclusion
Strip Chart LabVIEW is a powerful tool for real-time data visualization and monitoring. Its ability to continuously display live measurements makes it useful in automation, testing, and data acquisition applications.
By configuring the chart correctly and following best practices, engineers can build reliable monitoring systems that provide instant insight into process performance.
If you need custom LabVIEW development, real-time monitoring dashboards, data acquisition systems, or industrial automation solutions, Puja Controls can help. Our team develops reliable LabVIEW-based solutions tailored to industrial and testing applications.
Our expert team delivers solutions tailored to your exact requirements — from simple data monitoring setups to complete industrial automation systems.